



The 2026 State of Software Delivery found the largest year-over-year increase in throughput ever recorded. Workflow volume is up 59%, but on the flip side, main branch activity is falling. Teams are generating a lot more code, but most are struggling to turn that activity into shipped software.
How the AI delivery bottleneck affects your team has as much to do with your specific business requirements as it does your ability to integrate AI into your workflows. Breaking down the delivery data by industry, then, can give us useful insights into different ways the problem shows up and what teams like yours are doing to solve it.
In this issue of The Confident Commit, we’re looking at three industries that stand out in this year’s data, each for unique reasons: civil engineering, utilities, and retail. We’ll break down what each one is doing well, where they’re still falling short, and what their results can tell you about closing the gap between code generation and code delivery on your own team.
Civil engineering
Civil engineering teams validate more changes per day than any other industry. The typical project triggers 9.9 workflows every day, nearly 6x the median result across the entire dataset. On feature branches, where developers build and test new work before it’s ready for production, activity is 6.8 workflows per day.
That high volume likely reflects how civil engineering projects are structured: multiple parallel workstreams across structural, mechanical, electrical, and site systems, each being developed simultaneously. But the picture changes when you look at the main branch, where code actually ships to production. Throughput there drops to 1.8, right in line with what most teams run.
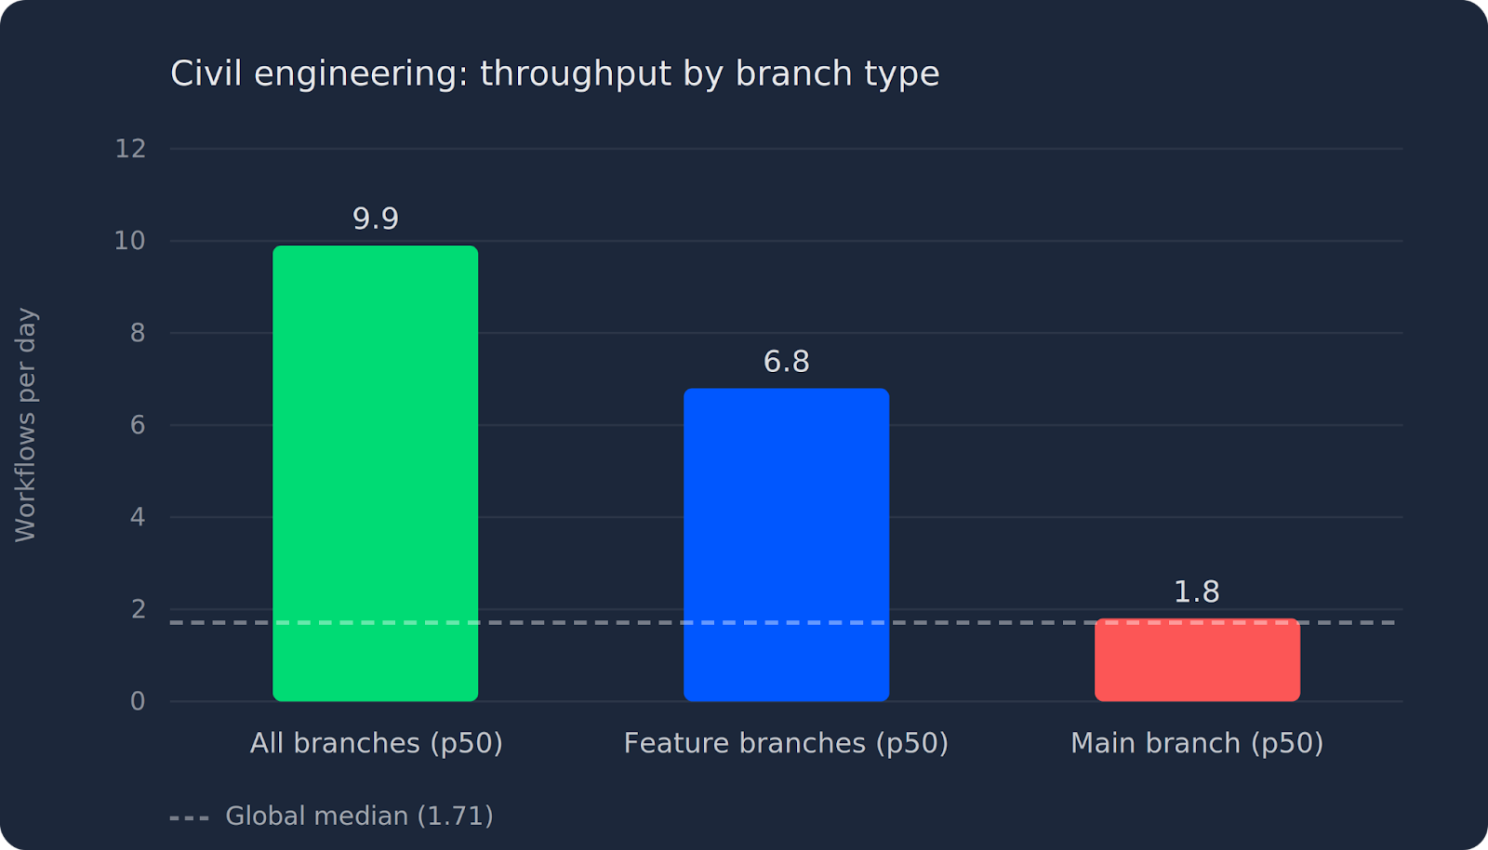
That’s a clear illustration of the AI bottleneck in action. These teams are generating massive amounts of code, but they are paying a heavy integration tax. Their complex, interconnected systems have to be validated against each other before anything can ship. That takes time, and it doesn’t scale linearly with volume.
Given the quality and compliance constraints in this vertical, a bottleneck at the integration stage makes sense. But it also means that despite having the highest overall throughput of any industry, civil engineering’s internal velocity rarely translates into faster project delivery
Utilities
So what does it look like when a team actually breaks through the production bottleneck?
Utilities teams run 7.6 workflows per day on feature branches and 7.8 on main. Both numbers are about 4x the current global median and represent a more than 2x year-over-year increase for this vertical. But what’s especially notable is that activity on main is keeping pace with feature branches. Where civil engineering teams are increasing code volume but struggling to integrate it, utilities teams are writing and shipping more code.
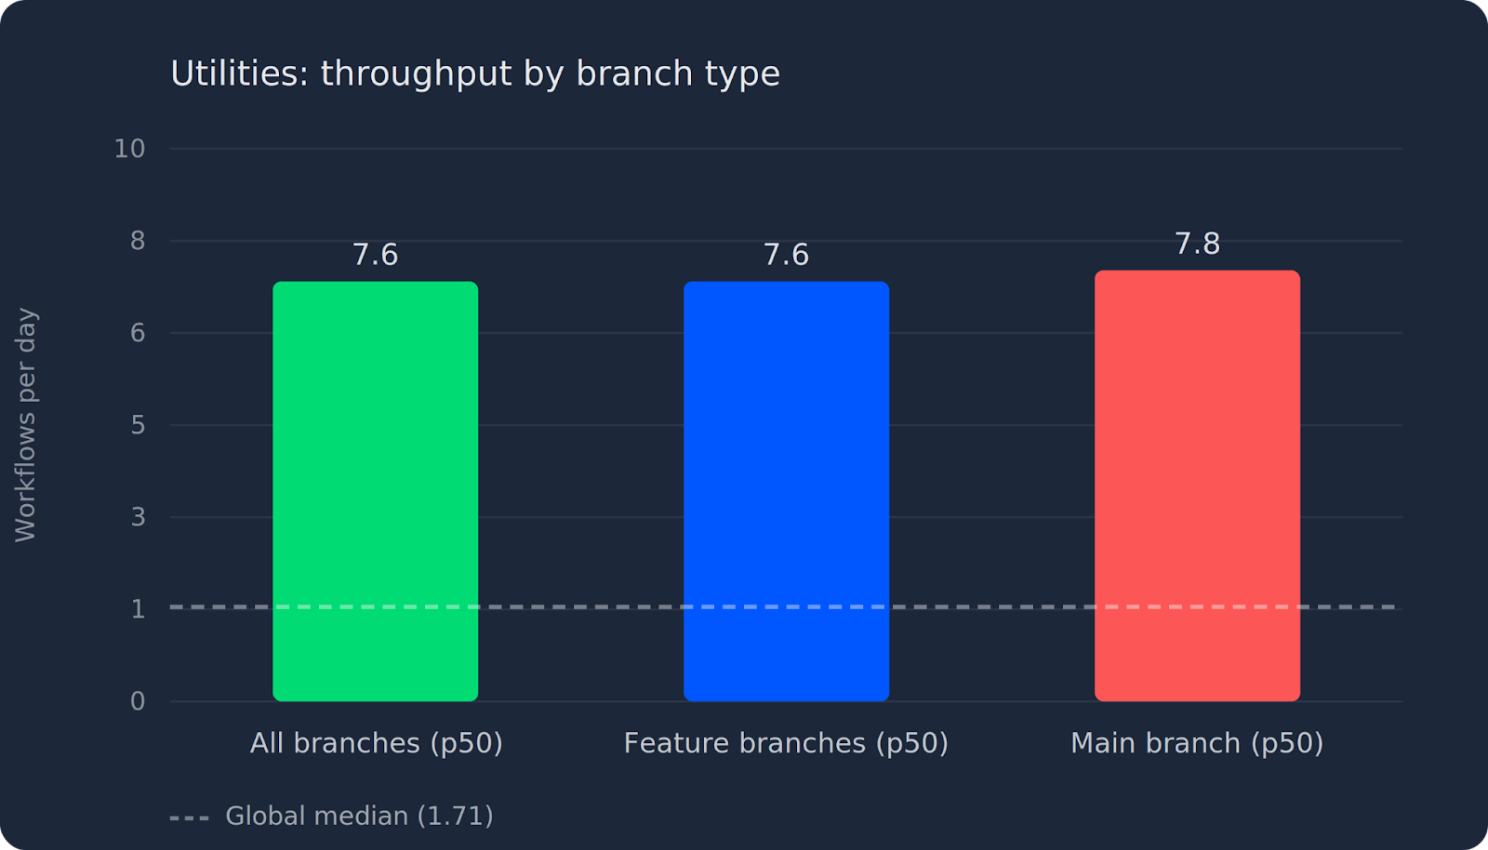
One possible explanation is business pressure. Utilities are critical infrastructure. Grid management, outage response, and regulatory reporting can’t wait. That urgency may push teams to ship smaller, more isolated changes that integrate cleanly rather than letting work pile up on feature branches. Civil engineering projects operate on longer timelines with less immediate consequence for any individual change, which may explain why parallel workstreams pile up and create integration complexity at main.
Whatever the reason, the data shows that utilities teams are shipping code as fast as they write it. But that’s not the complete story.
Utilities teams take approximately 400 minutes to recover from a failed build on main, compared to a global median of just 59 minutes. When something fails in a high-stakes pipeline, formal investigation steps take priority over speed regardless of how fast your CI system can rerun a build. But for a critical service that people depend on, almost 7 hours of blocked deployments has real consequences.
Retail
Like utilities, retail teams depend on 24/7 availability for their customers. While downtime for a retailer may not carry the same consequences as a utility outage, the impact on revenue and customer sentiment can be massive. That pressure has pushed retailers to optimize for uptime and fast recovery.
The typical retail team recovers from a failed build on main in 20 minutes. Most non-retail teams take 60 minutes or more.
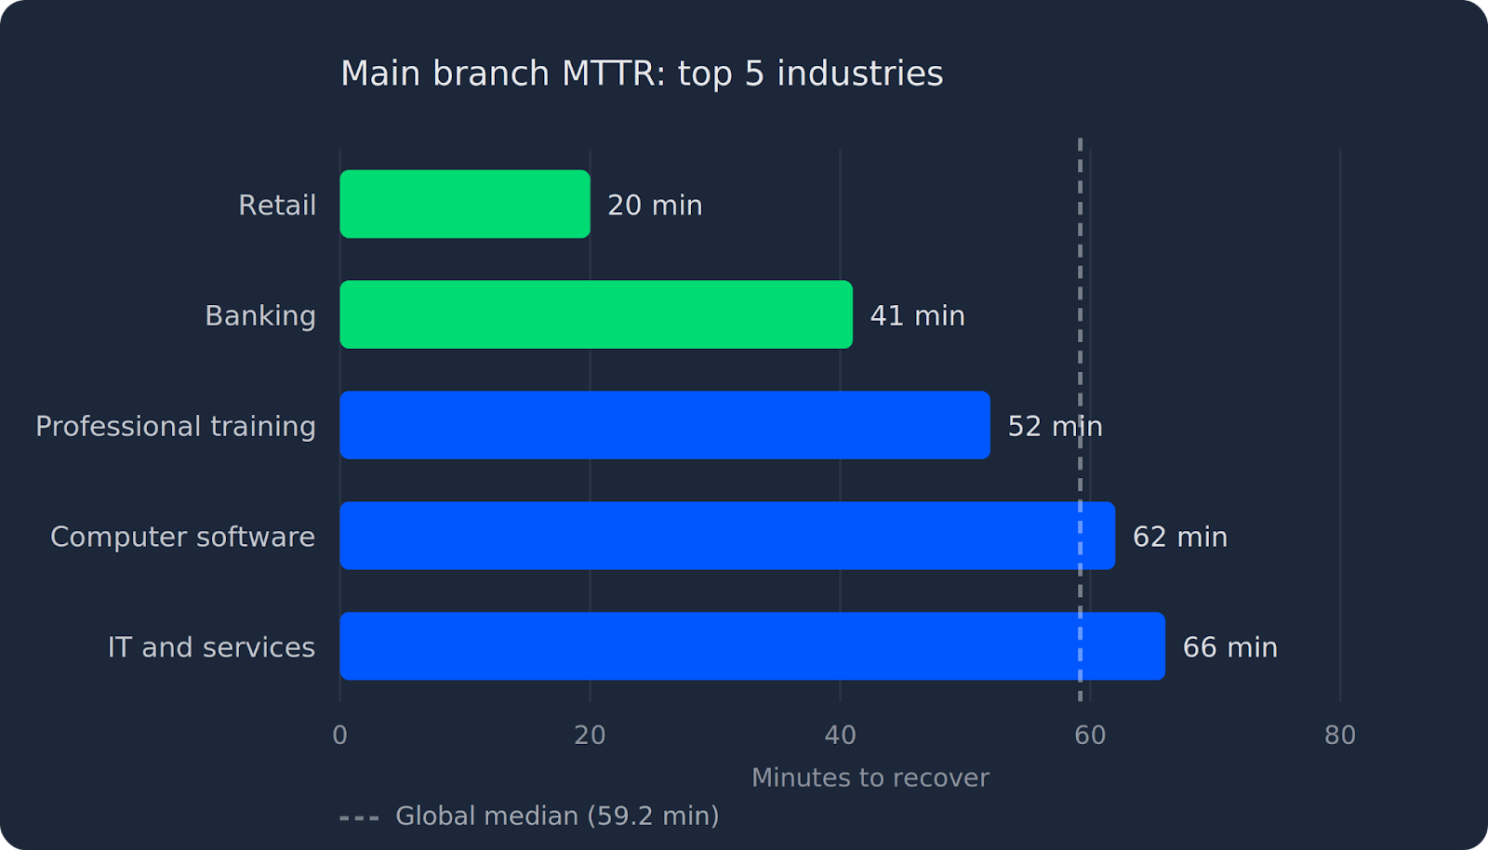
Not only does retail recover the fastest, but it’s also among the top performers on success rates. Retail workflows running on main succeed 85.2% of the time, placing them fifth among all industries. With these two metrics combined, retail is the strongest all-around performer on the metrics that matter most for reliability.
Banking tells a similar story. The typical banking team recovers from a failed build in 41 minutes, second only to retail, and maintains an 80.1% success rate on main. What retail and banking have in common is that the business cost of downtime makes recovery speed an organizational priority, not just an engineering goal. For these teams, MTTR is a financial metric.
What this means for your team
Each of these industries has optimized for the thing their business pressure demands and accepted a tradeoff elsewhere. Civil engineering iterates at massive volume but ships to production at an average pace. Utilities ships to production at a very high rate, but recovery takes nearly seven hours when something breaks. Retail recovers faster than any other industry because the revenue impact of downtime made it an organizational priority.
The question for your team is which of these dimensions is actually constraining you right now. If your feature branches are active but production is flat, you have a throughput-to-production problem, the same one civil engineering is paying for at scale. If your success rate is below 80%, you’re burning engineering time and tokens on failures that stack up with every change you generate. If recovery takes more than an hour, every failure blocks not just the build that broke but everything behind it in the queue.
This is what we’re building autonomous validation to solve: faster feedback, deeper context across your build history, and the ability to automatically resolve common failures before they turn into 400-minute recovery stalls or integration bottlenecks that keep code from reaching customers.
See where your team stands
The full 2026 State of Software Delivery breaks down performance by industry, region, and team size.
Want to benchmark your own metrics against these industries? The Software Delivery Data Explorer lets you compare your throughput, success rate, duration, and recovery time against teams in your specific segment.
Ready to start closing the gap between generation and delivery? CircleCI is free to get started.